The Asclepius Initiative's US Health Care Insurance Coverage Survey (2022)
What Kentuckians think of U.S. health care insurance coverage
The Asclepius Initiative undertook a survey of 1,000 adult Kentuckians to assess their attitudes and beliefs about U.S. health care insurance coverage, and their willingness to entertain alternative financing models.* The online survey was conducted between April and May 2022 by Qualtrics. Respondents were matched to Kentucky demographics with respect to gender, race/ethnicity, insurance status (uninsured, insured through employer, Medicaid, Medicare, (non-group), and urban vs rural. Below are some highlights of the survey. More information will be posted soon.
*With special acknowledgement to Liza Creel, PhD for primary data analysis, and thanks to Kaiser Family Foundation and IQS for their contributions to the survey instrument.

Cost of Care
Of Kentuckians surveyed, while the uninsured are the most likely to be unable to afford care, the same is true for over 6 out of 10 respondents with private insurance, Medicaid or Medicare.
Finite Finances
Nearly 4 out of 10 Kentuckians surveyed had to give up necessary commodities such as, food or clothing in order to pay for medical care.


How do Kentuckians feel about a national health insurance plan?
Overall, two-thirds of Kentuckians surveyed favor implementing a national government health plan. This outnumbers by nearly three times those respondents who oppose such a plan.
The Influence of Political Ideology
While Democrats and Republicans were equally likely to have avoided, skipped, or stopped medical care or medications due to cost (62%), Democrats were almost twice as likely to agree with paying higher taxes to get health care for everyone than Republicans (61% vs 37%).

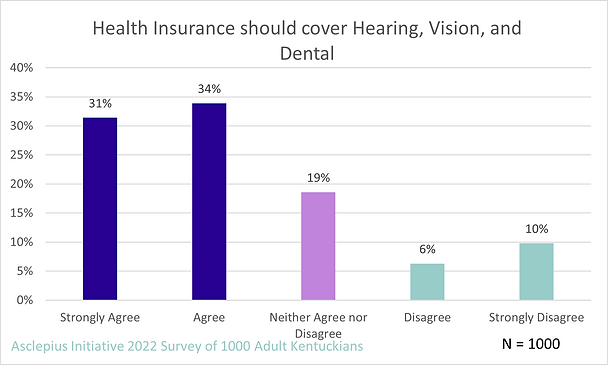
Kentuckians Value the Ability to See, Hear, and Chew
By a margin of 4:1 (65% vs 16%), Kentuckians surveyed believe that health insurance should cover Hearing, Vision, and Dental services.